

Maturity Detection of Camellia oleifera by Hyperspectral Imaging
2023/04/06Introduction
Camellia oleifera fruits picking period is affected by environmental factors, different regions have different weather, climate, temperature, soil fertility and other conditions, resulting in early and late maturity of Camellia oleifera fruits, so the picking time of oil tea fruit should be based on its specific. Mature degree depends. The last month before harvesting is the peak period of oil accumulation, during which the oil content of the fruit increases most significantly, accompanied by the mutual transformation of internal nutrients. However, during this period, the external morphological characteristics of the fruit, such as shape and size, fresh fruit quality and color, tend to be stable and do not change significantly, which makes it difficult for tea farmers to determine the maturity of the fruit and the optimal harvesting period. Therefore, there is an urgent need to propose a rapid and accurate method to detect the maturity of Camellia oleifera fruits, which can help in the accurate harvesting operation of Camellia oleifera fruits.
In this study, the hyperspectral data of Camellia oleifera fruits were obtained by hyperspectral imaging technology and the ripeness parameters of Camellia oleifera fruits were obtained by chemometrics method as reference, and the classification algorithm was used to discriminate the ripeness of Camellia oleifera fruits and verify the correctness of the classification model.
1 Materials and Methods
1.1 Materials
The Camellia oleifera fruits were collected from the camellia forest of Jinhang Camellia Professional Cooperative, Jiangning District, Nanjing City, Jiangsu Province. The collected Camellia oleifera fruits belonged to Frost's Descent seed varieties (mature before and after Frost's Descent). The specific sampling requirements are as follows: Camellia oleifera fruits on the sunny side of tea trees located at approximately the same altitude were collected, and the Camellia oleifera fruits were similar in size to ensure that samples in each batch were at the same ripeness level to the maximum extent.
1.2 Instruments and equipment
The hyperspectral imaging nondestructive testing platform built by the Biomass Packaging NDT Laboratory of Nanjing Forestry University is shown in Figure 1, including an imaging optical .The platform consists of an imaging spectrometer (GaiaField-V10E-AZ4, 400-1000nm), a detector (SCMOS camera), a white food-grade conveyor belt (HSIACSD800), an illumination system consisting of 1250W halogen lamps and a diffuse reflective dome, and a computer.
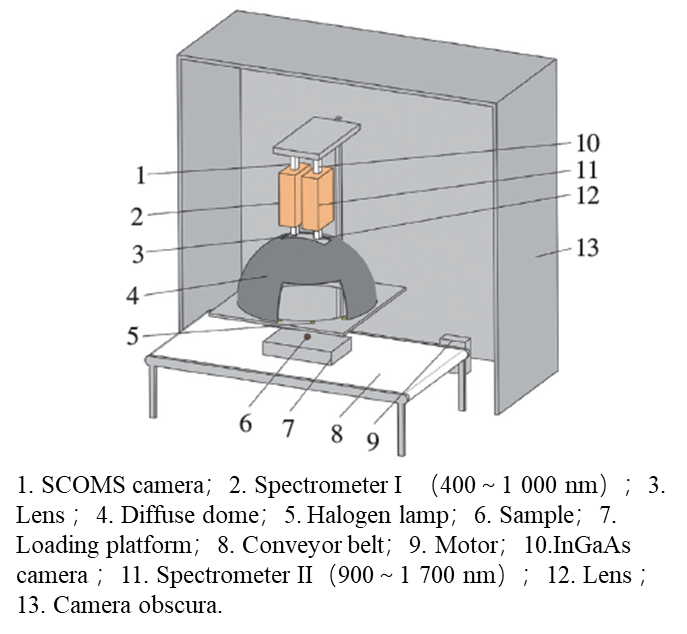
Fig. 1 Schematic of hyperspectral imaging system
2. Methods
2.1 Acquisition and calibration of hyperspectral images
The hyperspectral image data acquisition was based on the Specview software on the computer, and the hyperspectral instrument was preheated for 30 min before the image acquisition of the oil tea fruit. Due to the influence of dark currents in the hyperspectral image acquisition process and the uneven intensity distribution of the imaging system light source at different wavelengths, the acquired hyperspectral images contain a large amount of noise. Therefore, a black and white correction is applied to eliminate the effect of dark currents, as shown in Eq:
Re=(R0-D)/(W-D)
Where: Re is the corrected diffuse reflectance spectral image data; R0 is the original diffuse reflectance spectral image data of the sample; D is the dark image data; W is the diffuse reflectance image data of the whiteboard.
2.2 Curvature correction method
The large curvature of the surface of Camellia oleifera fruits makes the spectral intensity of each pixel point of the hyperspectral image of Camellia oleifera fruits vary considerably, so the variation in reflectance intensity must be corrected. The pixel-by-pixel spectral reflectance of the hyperspectral image is corrected using the mean normalization method.
3 Results and analysis
3.1 Physicochemical parameters of Camellia oleifera fruits at maturity
Ten samples from each batch were taken for the physical and chemical parameters such as fruit height, fruit diameter, fresh fruit quality, fresh seed quality, seed yield, oil content and water content of the husk, etc. The mean value of each physical and chemical parameter of each batch was taken as the physical and chemical value of the batch, and the mean and standard deviation of each physical and chemical parameter were calculated for the whole harvesting period, and the results are shown in Table 1.
Table 1 Changes in physicochemical parameters of C. oleifera with picking date
|
Physicochemical parameter |
Pick date |
Mean |
std |
|||||
|
10.13 |
10.20 |
10.27 |
11.03 |
11.10 |
11.14 |
|||
|
Fruit height/mm |
40.32 |
40.45 |
40.53 |
41.12 |
41.24 |
41.16 |
40.73 |
0.42 |
|
Fruit diameter/mm |
40.08 |
40.21 |
40.39 |
40.96 |
41.03 |
41.65 |
40.53 |
0.44 |
|
Fresh fruit quality/g |
28.40 |
27.32 |
29.60 |
30.21 |
30.64 |
30.55 |
29.23 |
1.22 |
|
Fresh seed quality/g |
10.27 |
10.36 |
11.30 |
12.98 |
11.85 |
12.64 |
11.35 |
1.12 |
|
Seed yield/% |
36.16 |
37.92 |
38.18 |
42.97 |
38.67 |
41.37 |
38.78 |
2.53 |
|
Oil content/% |
22.31 |
24.03 |
27.46 |
32.27 |
35.54 |
35.06 |
28.32 |
5.55 |
|
Fruit shell moisture content/% |
70.19 |
70.23 |
68.97 |
69.12 |
68.65 |
66.39 |
69.43 |
0.73 |
The ripeness of the Camellia oleifera fruits samples of maturity classes I to V increased in descending order, and the Camellia oleifera fruits of maturity class V was the fully ripe sample. In this study, the oil content was used as a measure of maturity and the quantitative criteria for maturity were given in Table 2.
Table 2 Changes in oil content in Camellia oleifera with picking date
|
Pick date |
Oil content/% |
||||
|
|
min |
max |
Median |
mean |
std |
|
10.13 |
20.36 |
23.64 |
22.30 |
22.31 |
0.93 |
|
10.20 |
22.60 |
25.12 |
24.12 |
24.03 |
0.73 |
|
10.27 |
25.74 |
29.13 |
27.08 |
27.46 |
1.02 |
|
11.03 |
30.72 |
24.57 |
32.25 |
32.27 |
1.12 |
|
11.10 |
33.82 |
37.25 |
35.53 |
35.54 |
1.13 |
|
11.14 |
34.13 |
37.00 |
34.91 |
35.06 |
0.84 |
3.2 Curvature correction of hyperspectral images of Camellia oleifera fruits based on pixel points
The large curvature of the Camellia oleifera fruits surface causes a large difference in the spectral intensity of each pixel point after hyperspectral imaging, and the spectral intensity from the central region of the Camellia oleifera fruits image towards the edges of the fruit gradually decreases, resulting in a lower spectral reflectance at the edges than at the center, which results in a larger error in modelling and classification using the data in this state directly, and is now corrected using the mean normalization method. 774 nm channel of the oil tea fruit sample The reflectance difference between the reflectance of the 774 nm channel and that of the background is the largest, so that this channel clearly shows the grey-scale map of the oil tea fruit samples. Figure 3 shows the pseudo-color distribution of the reflectance of the Camellia oleifera fruits seeds before and after correction in the 774 nm band, which shows that the distribution of the reflectance of the pixels of the oil seeds is more uniform than before correction, demonstrating the effectiveness of the mean normalization method.
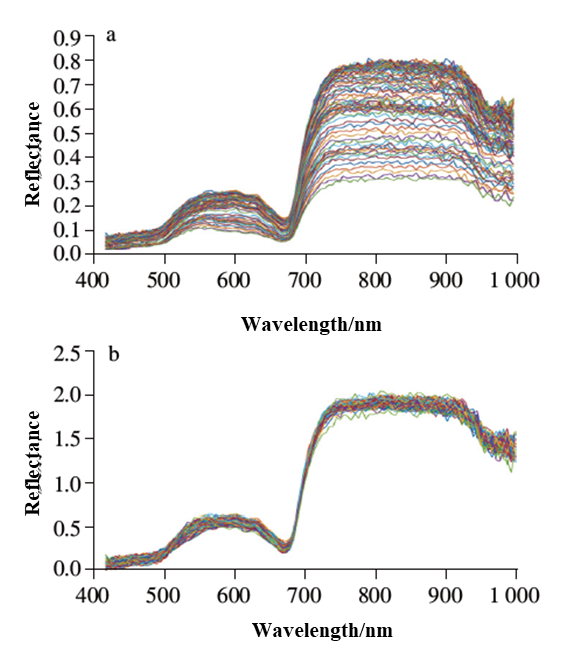
before (a) and after (b) correction
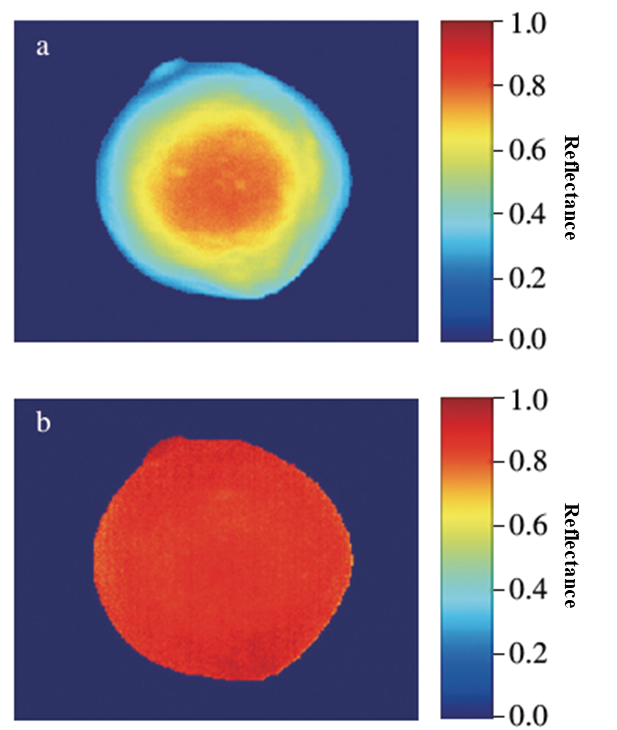
before (a) and after (b) correction at 774 nm
Between 720 and 970 nm, the reflectance intensity of the ripeness II-V samples decreased with increasing ripeness, while the reflectance intensity of the ripeness I-V samples increased and then decreased twice, probably due to the dynamic changes of the endogenous hormone content in the hull. The ripeness curves were significantly different at the five different harvesting time points, providing a theoretical basis for ripeness classification.
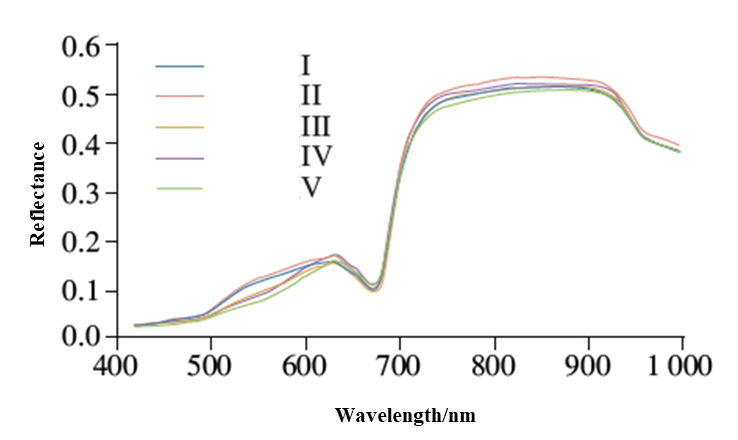
Fig. 5 Spectral curves with different maturities
3.3 Full-wavelength-based ripeness classification of Camellia oleifera fruits
The five different ripeness levels of Camellia oleifera fruits samples were assigned with category labels 1 to 5, and the full-wavelength spectral information-based ripeness classification models were established using KNN, RF, SVM and PLS-DA, respectively, and the parameters of each model were set as shown in Fig 6.
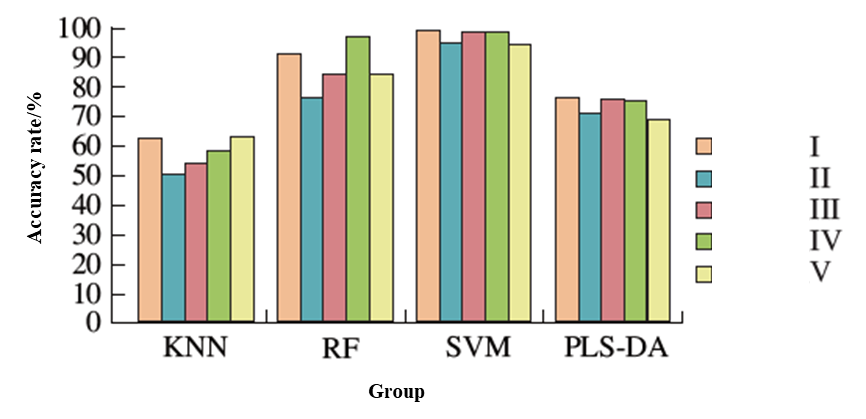
Fig. 6 Classification accuracy of different algorithms for samples at five maturity stages
3.4 Ripeness classification of oleander fruits based on the fusion of image features and spectral features
Color histograms were used to characterize the color features of hyperspectral images of Camellia oleifera fruits. Since the commonly used color spaces are RGB and HSV, the pseudo-color RGB images of the hyperspectral images were generated by taking the 64th (641.8 nm, red), 46th (552.3 nm, green) and 27th (459.8nm, blue) channels of the hyperspectral images respectively. A grey-scale co-occurrence matrix was also used to characterize the texture of the hyperspectral images of Camellia oleifera fruits. In order to describe the texture condition more intuitively with the grey-scale co-occurrence matrix, five parameters, namely energy, contrast, correlation, entropy and inverse disparity, were derived from the matrix.
Table 5 Results of SVM classification with different input characteristics
|
Features |
Number of features |
Training set accuracy |
Prediction set accuracy |
||||||||||
|
Ⅰ |
Ⅱ |
Ⅲ |
Ⅳ |
Ⅴ |
Mean |
Ⅰ |
Ⅱ |
Ⅲ |
Ⅳ |
Ⅴ |
Mean |
||
|
Color |
36 |
84 |
75 |
63 |
94 |
97 |
82 |
80 |
68 |
59 |
92 |
95 |
79 |
|
Texture |
5 |
40 |
52 |
39 |
40 |
64 |
47 |
33 |
46 |
38 |
35 |
62 |
43 |
|
Color+ texture |
41 |
79 |
80 |
63 |
96 |
95 |
83 |
66 |
75 |
62 |
90 |
92 |
77 |
|
Spectrum+ color |
64 |
97 |
91 |
90 |
98 |
98 |
95 |
93 |
89 |
88 |
96 |
97 |
93 |
|
Spectrum+ texture |
33 |
84 |
74 |
72 |
86 |
88 |
81 |
70 |
71 |
69 |
82 |
86 |
76 |
|
Spectrum+ color+ texture |
69 |
93 |
87 |
84 |
95 |
97 |
91 |
91 |
86 |
80 |
90 |
95 |
88 |
In general, the SVM classification model for Camellia oleifera fruits ripeness built by fusing color features and spectral features gave the best results, and the recognition rate of the model for ripeness I, IV and V Camellia oleifera fruits samples was generally higher than that for ripeness II and III samples, because the variability of feature parameters between ripeness I, IV and V Camellia oleifera fruits samples was large and easy to distinguish, while the difference in features between ripeness II and III samples was relatively small.
4 Conclusion
The feasibility of using hyperspectral imaging technology for maturity detection of Camellia oleifera fruits was investigated, using static measurements in the laboratory to observe and analyses the optical characteristics of Camellia oleifera fruits, based on which the accuracy of using the optical characteristics of Camellia oleifera fruits to determine the maturity of Camellia oleifera fruits was analyzed. The field trial to discuss the feasibility of spectral detection of Camellia oleifera fruits maturity in natural environment in combination with dynamic measurements in the field is currently in the proposal demonstration stage and will be conducted during the maturity period of Camellia oleifera fruits this year (October-November), laying the theoretical foundation for reaching a new stage of intelligent harvesting of oil tea first ripe first, later ripe later and as ripe as possible.


